
Full control
Wavelength range, sampling Δλ, microturbulence, μ-grid and line lists.
Pipeline of Radiative Intensity Synthesis for Meshed Atmospheric Surfaces: the intensity grids behind SPAMMS.
To compute the spectrum of a distorted star, SPAMMS needs to know how much light each surface element emits towards the observer, at every wavelength and every viewing angle. PRISMAS produces those specific-intensity grids. It wraps the synple spectral-synthesis code (Allende Prieto; SYNSPEC by Hubeny et al. 2021) and turns a folder of model atmospheres into SPAMMS-ready intensities and calibrated Eddington fluxes, for any wavelength range, sampling and microturbulence you choose.
| Grid | Physics | Typical use | --mode |
|---|---|---|---|
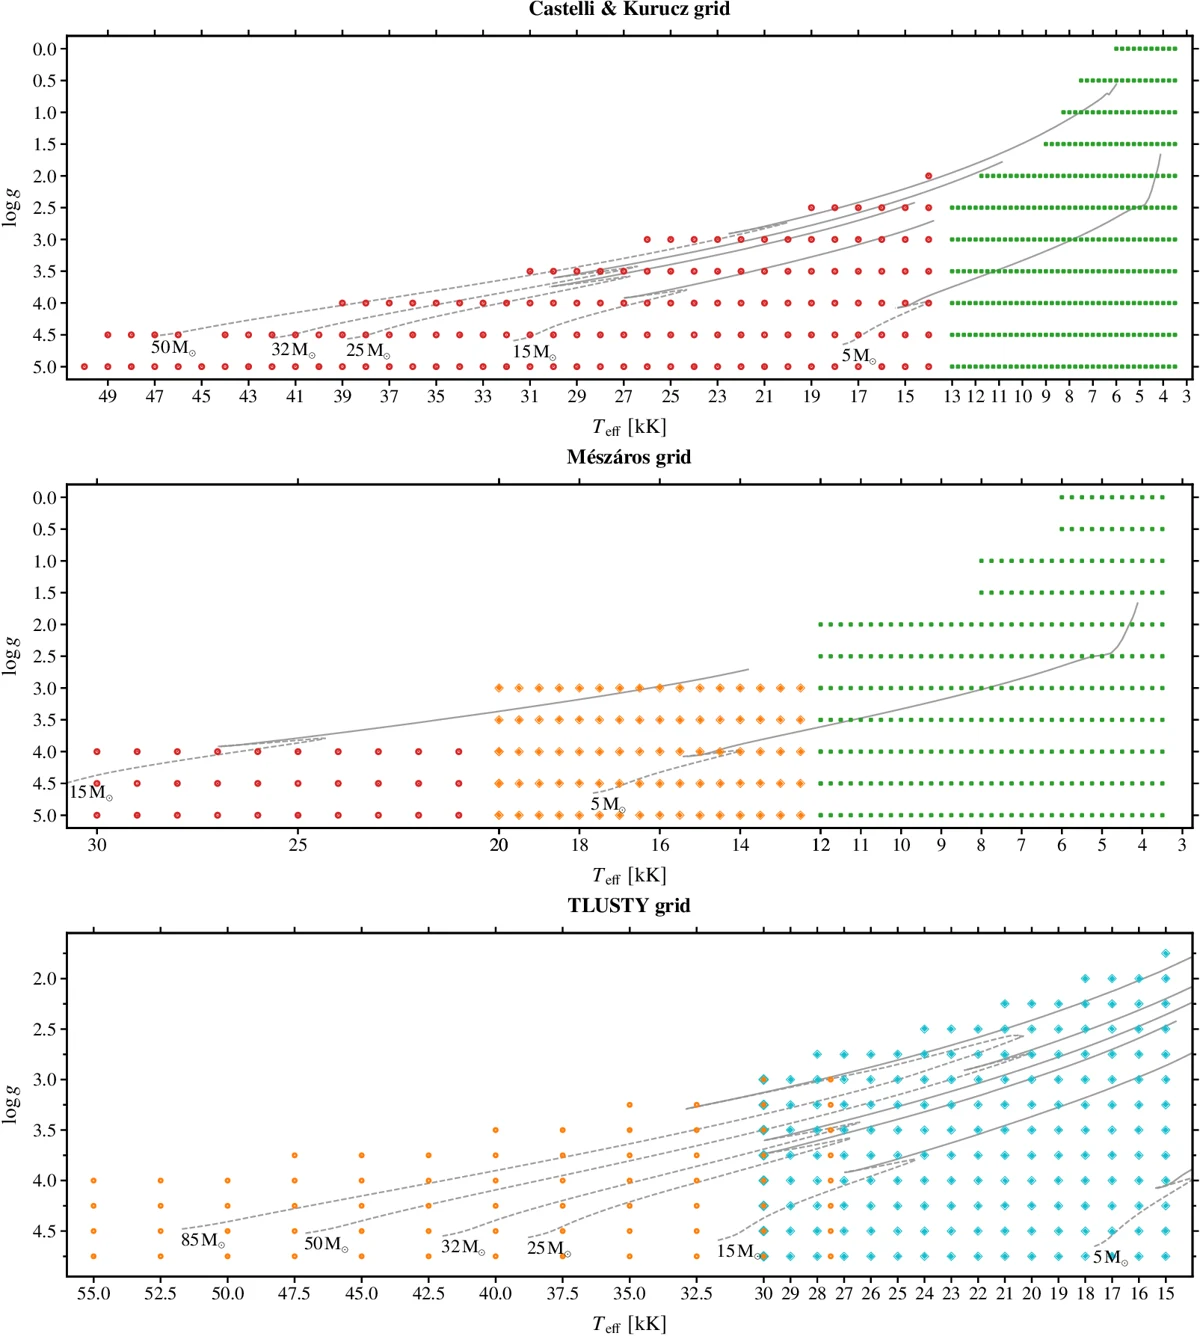
| ATLAS9, Castelli & Kurucz (2003) | LTE | O- to K-type stars | KC |
| ATLAS9, Mészáros et al. (2012) | LTE | Updated opacities, α and C enhancement | KM |
| TLUSTY OSTAR2002 / BSTAR2006 (Lanz & Hubeny 2003, 2007) | Non-LTE | Hot stars, Teff ≥ 15 000 K | T |
Wavelength range, sampling Δλ, microturbulence, μ-grid and line lists.
Teff, log g, [M/H], [α/M] and [C/M] decoded from each grid's native names.
Sparse μ grids rebuilt with PCHIP, or computed directly with the synple PRISMAS branch.
Single model, multiprocessing over a CPU pool, or job arrays on clusters.
NumPy arrays packed into .tar.gz, temporary files removed.
After installing synple and placing the atomic data and line lists as described in the README, run from the PRISMAS folder:
# one Kurucz-Castelli model, two microturbulences
python3 prismas.py --opt 0 --mode KC --modeldir ./Examples/kurucz_castelli/ \
    --model m0.50t49000g4.5am05k2odfnew.dat \
    --numpydir ./Examples/kurucz_castelli/results/ \
    --wl [3000,5000] --vmic [2,5] --dw 0.01

# a folder of TLUSTY models on 5 cores
python3 prismas.py --opt 1 --mode T --modeldir ./Examples/tlusty/ \
    --numpydir ./Examples/tlusty/results/ --wl [3000,5000] \
    --vmic [1.0,5.0] --dw 0.1 --linelist [gfTLUSTYALL.dat] --ncpus 5
Each model produces the wavelength vector, the specific-intensity and continuum-intensity matrices (101 μ × Nλ, μ from 0 to 1) and the integrated and continuum fluxes, in the layout SPAMMS expects.
The full grids from Galán-Diéguez et al. (2026) are already computed:
| Wavelength | 3000–9000 Å, Δλ = 0.01 Å |
|---|---|
| Microturbulence | 1, 3, 5 and 10 km s−1 |
| Angles | 101 values of μ = cos θ |
| Teff, log g, [M/H] | Grid-dependent, see the figure above and the paper |
The grids are too large to host publicly. Email me and I will arrange access.
The licence is MIT, with one condition: any publication or presentation that uses results from PRISMAS must cite this paper.
Galán-Diéguez et al. (2026)
@ARTICLE{2026arXiv260915331G,
       author = {{Gal{\'a}n-Di{\'e}guez}, D. and {Abdul-Masih}, M. and {Allende Prieto}, C. and {Berlanas}, S.~R. and {Herrero}, A. and {Sana}, H.},
        title = "{SPAMMS: 3D spectroscopic modelling of stellar surfaces. II. Implementation of Kurucz and TLUSTY model atmospheres}",
      journal = {arXiv e-prints},
     keywords = {Solar and Stellar Astrophysics, Earth and Planetary Astrophysics},
         year = 2026,
        month = sep,
          eid = {arXiv:2609.15331},
        pages = {arXiv:2609.15331},
archivePrefix = {arXiv},
       eprint = {2609.15331},
 primaryClass = {astro-ph.SR},
       adsurl = {https://ui.adsabs.harvard.edu/abs/2026arXiv260915331G},
      adsnote = {Provided by the SAO/NASA Astrophysics Data System}
}